Analysis
Compressonator CLI and GUI applications provides options for analysis and comparison between original and processed images.
Test Analysis Log Features And File Filters
Captures details of the source and destination files along with statistical data on performance and quality into a text file “process_results.txt”
Example: CompressonatorCLI.exe -log <source directory> <destination directory>
CompressonatorCLI Analysis
Compressonator CLI has a command line option to run Image Analysis on two sample images of the same dimension and format using the option -analysis
Example:
Step 1: Do compression on a sample source image, say we used BC7 on a source file Ruby.dds and the destination file Ruby_BC7.dds
CompressonatorCLI.exe -fd BC7 ruby.dds ruby_bc7.dds
Step 2: Check the result of the compressed image with the original
CompressonatorCLI.exe -analysis ruby.dds ruby_bc7.dds
The analysis results is saved to file Analysis_Result.xml
<?xml version="1.0" encoding="UTF-8"?>
<ANALYSIS>
    <ruby_ruby_bc7>
        <MSE>0.81335721644469494</MSE>
        <SSIM>0.99769089871409922</SSIM>
        <SSIM_BLUE>0.99735912437459595</SSIM_BLUE>
        <SSIM_GREEN>0.9974541763291831</SSIM_GREEN>
        <SSIM_RED>0.99825939543851883</SSIM_RED>
        <PSNR>49.027990366039383</PSNR>
        <PSNR_BLUE>48.733856839394129</PSNR_BLUE>
        <PSNR_GREEN>49.702877166369824</PSNR_GREEN>
        <PSNR_RED>48.71854158766061</PSNR_RED>
    </ruby_ruby_bc7>
</ANALYSIS>
Notice the markup label below <ANALYSIS> contains the source file name “ruby” and destination file name “ruby_bc7” appended by an underscore “ruby_ruby_bc7”
SSIM is the calculated average of RGB Channels. A simple file parser can then be used to run SSIM and other Matrix analysis for test automation.
if you wish to generate diff image file, run
“CompressonatorCLI.exe -analysis -diff_image ruby.dds ruby_bc7.dds” in Step 2.
A image diff (i.e. ruby_diff.bmp) will be generated. Please use the Compressonator.exe (UI app) to view the diff bmp file with adjusted brightness levels.
Analysis For Images In Folders
- Process a folder of images and performa analysis between images inside the source folder and destination folder
CompressonatorCLI.exe -fd <Codec format> <source directory> <destination directory>
Example: CompressonatorCLI.exe -fd BC1 -log ./images ./results
- Generate analysis report between a source image and a processed image
CompressonatorCLI.exe -analysis <source image file> <resulted image file>
For example: CompressonatorCLI.exe -analysis Boat.png result.dds
This option will generate an Analysis_Result.xml report file which contain the SSIM, PSNR and MSE values between the original and processed textures.
- Generate a difference image between a source image and a processed image
CompressonatorCLI.exe -diff_image <source image file> <resulted image file>
For example: CompressonatorCLI.exe -diff_image Boat.png result.dds
This option will generate difference between 2 images with same size. A result_diff.bmp file will be generated. Please use compressonator GUI to increase the contrast to view the diff pixels.
- Print image properties of an image file.
CompressonatorCLI.exe -imageprops <image file>
For example: CompressonatorCLI.exe -imageprops Boat.png
This option will print file name, path, size, image width, height, mip levels and format.
Analysis Views
A new table view is provided for users to view test analysis results for performance, PSNR and SSIM analysis during and after processing of image textures. Previously in v3.1 user would have to run “Image Difference Views” on each processed texture to view PSNR and SSIM results, which ends up been very time consuming for large number of images. An amalgamated results view is now available for users to collect and review results for processed images. To enable this feature, select the “Show MSR PSNR SSIM Results” and optionally “Show Analysis Results Table” in the “Applications Settings” menu as shown:
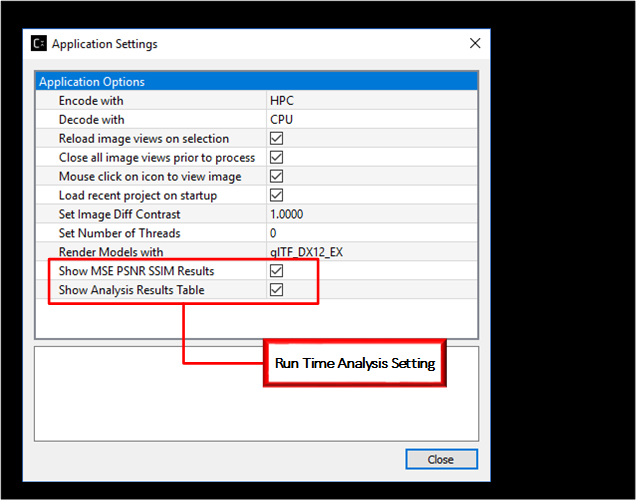
Show MSR PSNR SSIM Results
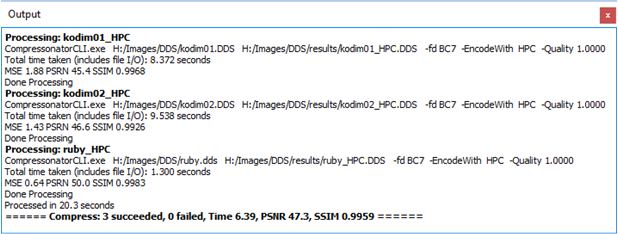
Enables the analysis results feature. Each processed item will display a MSE, PSNR and SSIM as it is been processed on the output window. A summary of the average processing time PSNR and SSIM is displayed once all processing is completed (MSR average results is not collected as its already included in the PSNR calculations). It also enables the “Show Analysis Results Table” for selection. This selection is active only when “Show MSR PSNR SSIM Results” is enabled, else the table will not be shown after processing
Show Analysis Results Table Displays this table after any image is been processed (TIME is in Seconds, PSRN is in dB and SSIM is an index in range of 0…1)
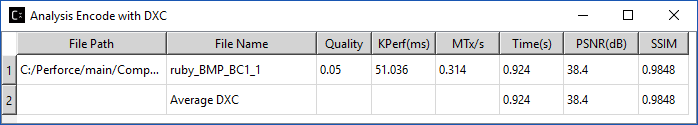
When processing images the table view will be displayed and can be used to gather results and analysis data for reports, by simply selecting the required rows and columns in the table then copy (Ctrl+C) and pasting (Ctrl+V) the table view.
KPerf(ms) (Beta Feature)
This estimates the time it takes to process 1000 (4x4 pixel) blocks, using the current encoder and GPU setup. where Perf(ms) is the time it took to process a single block of 16 pixels in milliseconds.
HPC performance monitoring uses CPU timers. while OCL & DXC uses GPU performance query timers. For CPU based encoding KPerf & MTx is not measured.
MTx/s (Beta Feature)
This is a measurement of the time it takes to process 1 Million texels in a second.
Time(s)
CPU performance based timing, that measures the overall end to end time it took for the image to be processed. It includes device setup, loading image to GPU, receiving the image from GPU and file IO.
Please note the following
- Analysis is not supported for processes that are: Lossless, HDR to LDR or LDR to HDR
- The table view is re-sizable by mouse clicking on and dragging the table edges and dividers.
- The resized view and table position are not saved and is reset when the GUI application is restarted.
- Table Header labels are not copied.
- Table content is cleared when any of the image textures are been reprocessed.
- When enabled, the table will remain as a topmost windows view.
- During processing the table content is been updated.
- When deselecting the analysis table view from the “Applications Settings” menu, the table will still remain visible, it is cleared only when a image is been processed.